ACoS vs TACoS on Amazon: What Each One Is and Which to Watch

By the Finnex Agency team
TL;DR
- ACoS measures campaign efficiency; TACoS measures the sustainability of the whole Amazon business (ad spend over total sales).
- ACoS dropping while TACoS rises is a red flag: you're cannibalizing organic sales with paid ads.
- Use ACoS for tactical decisions. Use TACoS for strategic and financial ones.
ACoS (Advertising Cost of Sales) is how much you spend on ads for every euro you sell through those ads. TACoS (Total Advertising Cost of Sales) is how much that same ad spend weighs against all your sales, paid and organic combined.
The whole difference sits in the denominator: ACoS divides spend by ad-attributed sales, TACoS divides it by total sales. That is why ACoS tells you whether a campaign is efficient, and TACoS tells you whether the business holds up.
In numbers
Ad spend: €1,000 · Ad-attributed sales: €4,000 · Total sales: €10,000
ACoS = 1,000 ÷ 4,000 × 100 = 25%
TACoS = 1,000 ÷ 10,000 × 100 = 10%
Advertising cost 25% of what it sold through ads, and 10% of everything the product sold.
Knowing which to watch — and when — is the difference between optimizing well and optimizing the wrong thing.
How to calculate them step by step
If you have never pulled these numbers, this is the short path inside Seller Central:
- Ad spend and ad sales. Open Campaign Manager and download the campaign report for the period you want to measure. Both ACoS inputs come from there.
- Calculate ACoS. Spend ÷ ad-attributed sales × 100.
- Total sales for the same period. Seller Central → Reports → Business Reports → Detail Page Sales and Traffic by Child Item. Filter by the same ASIN and the same date range.
- Calculate TACoS. Spend ÷ total sales × 100.
- Compare against your margin. Your break-even ACoS is your gross margin before advertising. And read the 4-to-8-week trend, never a single day.
Both numbers come from the same spend. The only thing that changes is which sales you compare it against.
01 — The mistake almost everyone makes
Why looking only at ACoS can be dangerous
Picture this scenario.
A seller has a product running at 18% ACoS. Profitable, in control, within margin. An external campaign manager comes into the account, sees an opportunity to improve that number, and lowers bids on the highest-spend campaigns.
Result: ACoS drops to 12%. The manager celebrates. The seller celebrates.
Three weeks later, total sales fall 28%. The product loses organic ranking. BSR worsens. What looked like an optimization was actually an amputation.
What really happened?
The campaigns that were paused weren't just generating direct sales: they were sustaining the conversion volume that kept the product well-ranked in organic results. By reducing spend, paid sales got cut and, in a chain reaction, organic sales collapsed too. ACoS improved. The business got worse.
This happens when you optimize ACoS without monitoring TACoS. They're different metrics that answer different questions. Using them interchangeably is one of the most silent — and costly — mistakes in Amazon Ads management.
02 — The first metric
ACoS: the lens on your campaigns
ACoS stands for Advertising Cost of Sales. It measures what percentage of the revenue directly generated by your ads was spent to pay for those same ads.
ACoS formula
ACoS = Ad spend ÷ Sales attributed to ads × 100
You spent $300 on campaigns and generated $1,500 in direct sales from ads → ACoS = 20%
It's a tactical efficiency metric. It tells you, campaign by campaign and keyword by keyword, how much each dollar of sales generated through paid advertising costs you.
Breakeven ACoS: the number that changes everything
Before you know whether your ACoS is good or bad, you have to calculate your breakeven ACoS: the maximum percentage you can spend on advertising without the product becoming unprofitable.
How to calculate it
Breakeven ACoS = Product gross margin × 100
If your gross margin after product, logistics and Amazon fees is 35%, your breakeven ACoS is 35%.
Below that number → the campaign generates profit. Above → the campaign consumes more than it returns.
A high ACoS isn't always an alarm. During launches, it's completely normal to spend above breakeven in exchange for ranking, reviews and sales velocity. What matters is whether there's strategic justification or it's just undiagnosed inefficiency.
| Scenario | Breakeven ACoS | Profitable ACoS | Loss ACoS |
|---|---|---|---|
| 25% gross margin | 25% | Below → profit | Above → loss |
| 35% gross margin | 35% | Below → profit | Above → loss |
| 50% gross margin | 50% | Below → profit | Above → loss |
Reference only. Gross margin must include product cost, FBA logistics and Amazon fees, before advertising.
What ACoS is useful for day-to-day
- Comparing performance between campaigns, ad groups and keywords.
- Identifying search terms that consume budget without converting.
- Adjusting bids with per-product profitability logic.
- Making quick tactical decisions: where to pause, where to scale.
What ACoS can't do is give you a complete picture of the business. That's what TACoS is for.
03 — The second metric
TACoS: the map of the whole business
TACoS stands for Total Advertising Cost of Sales. The difference with ACoS is in the denominator: instead of dividing by ad sales, it divides by total product sales, including organic sales.
TACoS formula
TACoS = Ad spend ÷ Total sales (organic + paid) × 100
You spent $300, ad sales $1,500, organic sales $3,500 → TACoS = 300 ÷ 5,000 = 6%
That seemingly small difference makes it a completely different kind of metric.
The question TACoS answers and ACoS can't:
What share of my Amazon business depends on advertising to function?
If advertising stops tomorrow, how much of the sales survive?
Why TACoS is always lower than ACoS
This has simple mathematical logic: the TACoS denominator (total sales) will always be greater than or equal to the ACoS denominator (ad sales). The gap between the two numbers is exactly the size of your organic sales.
| ACoS | TACoS | |
|---|---|---|
| Formula | Ad spend ÷ Ad sales × 100 | Ad spend ÷ Total sales × 100 |
| Example | $200 / $1,000 = 20% | $200 / $5,000 = 4% |
In this example, the gap between ACoS (20%) and TACoS (4%) reveals that 70% of sales are organic. If that number were 0%, both metrics would be identical.
What TACoS is useful for in practice
- Evaluating whether advertising is building organic ranking or just buying sales.
- Measuring the real financial health of the product beyond campaign efficiency.
- Detecting structural dependence on ad spend.
- Making investment and scaling decisions based on total impact, not just the paid channel.
- Identifying products that could benefit from more advertising (very low TACoS can signal under-investment).
04 — Both together
ACoS vs TACoS: what we talk about in each case
The two metrics don't compete. They're complementary. Each operates at a different level of analysis.
| ACoS | TACoS | |
|---|---|---|
| What it measures | Ad campaign efficiency | Real impact of ads on the business |
| Denominator | Sales attributed to ads only | Total sales: ads + organic |
| Question it answers | Are my campaigns profitable? | How much does my business depend on ads? |
| Type of decision | Tactical: bids, keywords, pauses | Strategic: scale, budget, ranking |
| Most useful stage | Launch and campaign optimization | Growth, maturity and long-term analysis |
| Main limitation | Doesn't see organic sales | Needs reliable total-sales data |
05 — What the difference between them reveals
How to read the gap between ACoS and TACoS
The most valuable information isn't in each metric separately. It's in the relationship between the two.
When TACoS and ACoS get close together, it means almost everything the product sells comes from advertising: little or no organic traction. When the gap widens — TACoS much lower than ACoS — it means organic sales are contributing meaningfully and the business doesn't depend solely on paid spend.
| Scenario | What it indicates | Reading |
|---|---|---|
| TACoS much lower than ACoS | Organic sales already contribute meaningfully. Ads aren't carrying everything. | ✓ Positive signal |
| TACoS ≈ ACoS | Almost all sales come from ads. Little or no organic traffic. | ⚠ Alert |
| TACoS dropping + stable or rising sales | Advertising is building organic ranking. Virtuous cycle active. | ★ Ideal target |
| TACoS rising + stable ACoS | Spend grows but total sales don't. Review structure and relevance. | ✗ Urgent review |
The virtuous cycle: how it should look over time
When the PPC strategy is working well, the expected behavior of these metrics over time has a clear logic:
- Initial phase: high ACoS and TACoS close to ACoS. Normal. Almost everything comes from advertising.
- Building phase: as sales volume generates conversion history, the product starts gaining organic ranking. TACoS begins to separate from ACoS.
- Maturity phase: TACoS stable and significantly lower than ACoS. The product has a balance between organic and paid traffic. Advertising no longer carries everything.
Alert signal to monitor
If you cut ad spend and ACoS improves but TACoS rises or stabilizes at a high level, you've activated a negative cycle: less advertising → fewer paid sales → worse ranking → fewer organic sales. Once this cycle sets in, it's costly to reverse.
06 — The most common mistakes
What breaks when these metrics are misread
1. Lowering ACoS without watching TACoS
This is the mistake from the example at the start. An ACoS that drops can look like an improvement, but if total sales fall and TACoS rises in parallel, the optimization was destructive. The right metric to evaluate the impact of a budget change isn't ACoS alone — it's TACoS.
2. Comparing TACoS between products without context
An 8% TACoS can be extraordinary for a mature product with high organic volume, or completely unsustainable for one with a 15% margin. It should always be read alongside gross margin and product stage. Without that context, the number says nothing useful.
3. Mixing brand campaigns with generic campaigns in analysis
Brand defense campaigns have artificially low ACoS because the user already knows the product and converts with high probability. If you mix them in analysis with conquest campaigns or generic terms, both metrics get distorted. Proper analysis segments by campaign type before drawing conclusions.
4. Reading improvements without isolating seasonality
During high-demand periods — Prime Day, Black Friday, Q4 or key category dates — both ACoS and TACoS naturally improve due to increased conversions. Attributing that improvement to advertising strategy without separating the seasonal effect leads to wrong decisions in both directions.
5. Ignoring that a very low TACoS can also be a problem
A very low TACoS isn't always a sign of health: it can indicate under-investment in advertising. If a product has strong organic ranking and 3% TACoS, there may be a real opportunity to scale sales by increasing spend without compromising overall profitability. The goal isn't minimizing TACoS — it's keeping it in a range that makes sense given the margin and product stage.
07 — When to use each metric
Practical framework by product stage
The relative weight of each metric in decisions isn't fixed: it changes depending on where the product is in its lifecycle.
| Stage | Key metric | Reference | Main focus |
|---|---|---|---|
| Launch (0-90 days) | ACoS | 40-60% normal | Generate sales velocity and reviews. High ACoS is investment, not error. |
| Growth | ACoS + TACoS | TACoS dropping | Both metrics in parallel. Validate organic starts growing. |
| Maturity / Scale | TACoS | 10-20% sustainable | Business is measured on total sales. ACoS still useful for tactical tuning. |
Industry-reference TACoS ranges: 10-20% for sustained scale. At launch, TACoS can exceed 40-50% without being a negative signal.
One important thing: in launch phase, the focus shouldn't be TACoS but sales velocity, reviews and ranking. TACoS becomes a relevant metric when there's enough organic history to compare.
08 — Frequently asked questions
What is ACoS on Amazon?
ACoS (Advertising Cost of Sales) is the percentage of ad-generated sales that went into paying for those ads. You calculate it by dividing ad spend by ad-attributed sales and multiplying by 100. Spend €300, sell €1,500 through ads, and your ACoS is 20%. Use it to decide where to raise bids, where to pause, and which keywords are not pulling their weight.
What is TACoS on Amazon?
TACoS (Total Advertising Cost of Sales) measures the same ad spend, but against the product's total sales: the ones that came from ads and the organic ones. With €300 of spend, €1,500 in ad sales and €3,500 in organic sales, TACoS is 300 ÷ 5,000 = 6%. It answers a question ACoS cannot: how much of your business depends on advertising to work.
Which one should I watch?
Both, for different decisions. Watch ACoS for tactical campaign moves: bids, keywords, budgets, what to pause. Watch TACoS for business decisions: whether to scale spend, whether the product is gaining organic traction, whether the account is sustainable. At launch, ACoS leads; at maturity, TACoS does.
Why does my ACoS drop while sales fall?
Because you cut campaigns that were holding up the organic ranking. Lowering bids improves ACoS right away, but the product loses sales velocity and search position. Less position means fewer organic sales, and the total drop ends up larger than the savings. The warning sign is an ACoS going down while TACoS climbs or sits still at a high level.
What is a good TACoS on Amazon?
It depends on margin and product stage, so there is no single number. As an industry reference, 10% to 20% is sustainable for a product at scale, and at launch it can exceed 40% without being a bad sign. What matters more than the absolute value is the trend: a TACoS falling while sales hold steady or grow means advertising is building organic.
09 — To wrap up
The right metric is the one that answers the right question
ACoS tells you whether your campaigns are efficient.
TACoS tells you whether your business on Amazon is sustainable.
These are different questions. And both matter.
Prioritizing only ACoS can lead to tactical optimizations that erode organic position without anyone noticing until the damage is already done. Prioritizing only TACoS without understanding campaign efficiency makes it impossible to know where to act.
The smart reading of both metrics, cross-referenced with margin and product stage, is the foundation of any PPC strategy that aims to scale with judgment instead of blindly.
Three-line summary
ACoS → campaign efficiency. Tactical tool.
TACoS → business health. Strategic tool.
Reading them together → the only way to optimize without breaking what works.
When your account numbers do not add up
If your Amazon Ads account is active but you don't have clarity on whether the investment is building business or just sustaining sales, there are three ways to start with us:
- Free listing analysis. No Seller Central access needed, answer within 48 business hours. It is the lowest-commitment first step, and the same page covers the full audit if you want the diagnosis with real campaign data.
- 1:1 consulting. A session to settle one specific question with someone who has seen the problem before. You leave with a plan, not with more questions.
- Campaign management. If you would rather hand over the day-to-day, this is how we run PPC.
Keep reading
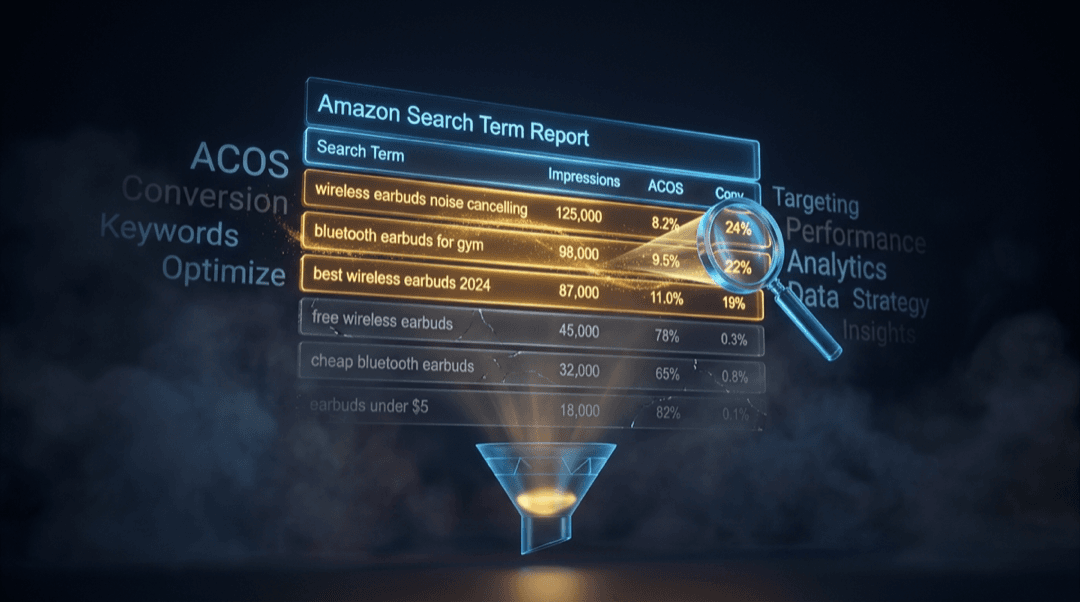
How to Analyze the Search Term Report Correctly
The Search Term Report shows what shoppers actually searched. Learn to read it with the 4-quadrant framework and optimize your Amazon PPC.
Read more →
Amazon Ads Scaling Strategy: From Campaigns to Growth
How to move from active campaigns to a real Amazon Ads scaling system: structure, the PPC-organic flywheel, inventory, and TACoS.
Read more →
How to Tell if Your Amazon PPC Is Poorly Structured
Your account can be running campaigns and still be poorly structured. 8 signals that something is broken in your Amazon Ads before scaling spend.
Read more →